IELTS Writing Task 1 Academic: Graphs, Charts & Maps Complete Guide (2026)
IELTS Writing Task 1 Academic requires you to describe visual data — and the IELTS Writing Task 1 graph and chart types each demand a completely different approach. Using the wrong language for a bar chart vs a pie chart, or describing a process with trend verbs, are errors that cost you marks in both Task Achievement and Lexical Resource. This guide covers every chart type with model phrases and structure. Test your writing with our free AI IELTS feedback tool that scores Task 1 responses on all 4 criteria instantly.
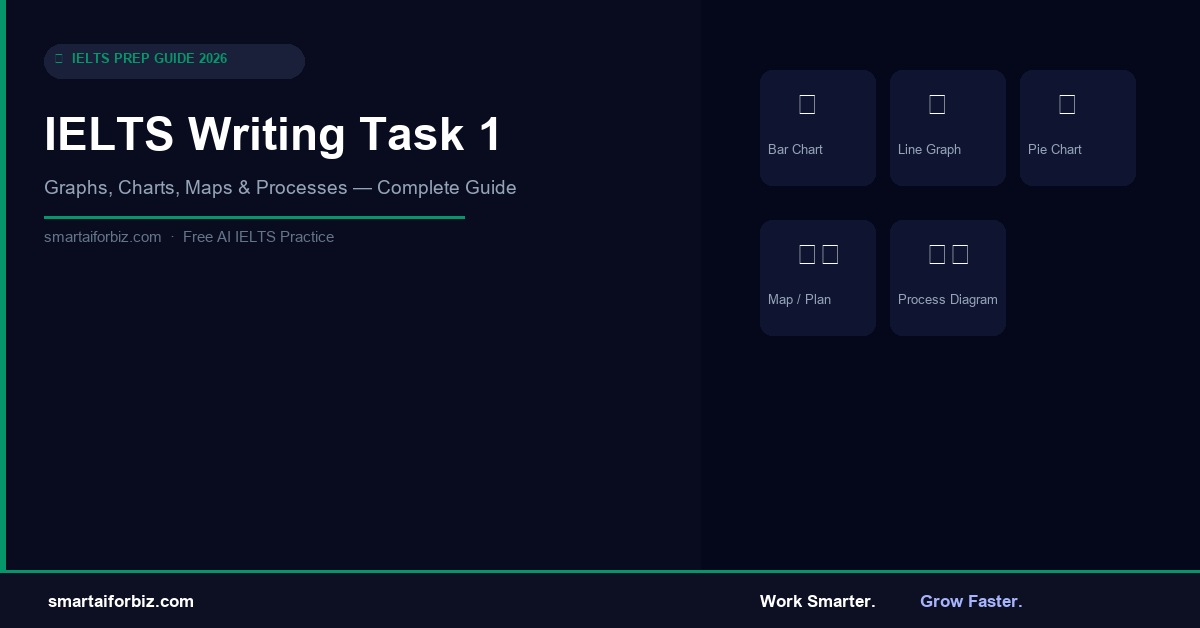
The 5 IELTS Writing Task 1 Chart Types
| Chart Type | What It Shows | Key Language |
|---|---|---|
| Bar Chart | Comparisons at a point in time or over time | higher than, significantly more, the largest proportion |
| Line Graph | Changes and trends over a time period | rose sharply, fluctuated, reached a peak of |
| Pie Chart | Proportions/percentages of a whole | accounted for, represented, the majority of |
| Table | Multiple data sets for comparison | the highest figure was, compared to, in contrast |
| Map / Plan | Changes in a location over time or two locations | was replaced by, has been extended, to the north |
| Process Diagram | How something is made or works | is then, after that, the final stage involves |
| Mixed Charts | Two different visuals (e.g. bar + line) | while, whereas, in contrast, simultaneously |
Practice Writing Task 1 With Instant AI Feedback
Submit your Task 1 response and get a band score in under 10 seconds. The AI evaluates Task Achievement, Coherence, Lexical Resource and Grammar separately.
✅ Instant band score
✅ No signup · Free
Writing Task 1 Structure (All Chart Types)
Every Task 1 response should follow a 4-paragraph structure regardless of the chart type:
- Introduction (1–2 sentences): Paraphrase the question prompt. Never copy it word for word.
- Overview (2–3 sentences): Describe the 2–3 most significant features. No numbers here. This is the most important paragraph for Task Achievement.
- Body Paragraph 1: Detailed description with specific data and comparisons.
- Body Paragraph 2: Second group of data or second time period.
Critical rule: The overview is not optional. Candidates who skip the overview score maximum Band 5 for Task Achievement, regardless of how accurate their data reporting is.
Line Graph Language: Describing Trends
| Trend | Verbs (subject = noun) | Nouns (there was a…) |
|---|---|---|
| Sharp increase | rose sharply, surged, soared | sharp rise, dramatic increase |
| Gradual increase | grew steadily, climbed gradually | steady growth, gradual rise |
| Sharp decrease | fell sharply, plummeted, dropped | sharp fall, dramatic decline |
| Gradual decrease | declined slowly, decreased gradually | gradual decline, slow drop |
| No change | remained stable, levelled off, plateaued | period of stability |
| Fluctuation | fluctuated, varied, oscillated | fluctuation, variation |
| Peak | reached a peak of, hit a high of | a peak of, a high of |
| Trough | reached a low of, hit a trough of | a trough of, a low of |
Map and Process: Special Rules
Maps and process diagrams require passive voice and spatial/sequential language, not trend verbs. Using “increased” for a map description is a Lexical Resource error.
Map language: “The forest was replaced by a housing estate.” / “A new road was constructed to the east of the river.”
Process language: “The raw material is fed into the machine.” / “Once heated, the mixture is transferred to the next chamber.”
Common Task 1 Mistakes That Drop Your Band Score
| Mistake | Impact | Fix |
|---|---|---|
| No overview paragraph | Maximum Band 5 for Task Achievement | Always write 2–3 sentences summarising the key trends |
| Copying the question introduction | Lexical Resource penalty | Paraphrase: change word forms and sentence structure |
| Describing every data point | Loses coherence and word count | Select 3–4 most significant figures only |
| Using trend verbs in a process | Lexical Resource error | Use passive voice: “is produced”, “is transferred” |
| Under 150 words | Automatic Task Achievement penalty | Aim for 165–185 words |
| No comparisons | Lower Coherence score | Always compare groups, time periods or values |
Get AI Feedback on Your Task 1 Writing
Practise bar charts, line graphs, maps and process diagrams. Our AI tells you exactly which paragraph lost you marks and why.
✅ Instant band score
✅ No signup · Free
Frequently Asked Questions
How many words should I write for Task 1?
The minimum is 150 words. Writing under 150 results in an automatic penalty for Task Achievement. Most Band 7+ responses are 165–185 words. There is no upper word limit, but going over 200 words risks wasting time from Task 2.
Do I need a conclusion for Task 1?
No. Task 1 is a factual description, not an essay. Do not add opinions, conclusions or recommendations. The overview paragraph serves as your closing summary.
How much is Task 1 worth vs Task 2?
Task 2 is worth twice as many marks as Task 1. Spend approximately 20 minutes on Task 1 and 40 minutes on Task 2.